
Cross-border payments are financial transactions occurring between the payer and the payee located in different countries. For many companies, such payments are now a common and often essential part of their business operations.
This market is growing in both the B2B and B2C segments, creating great opportunities for fintech startups to capture a share of the market. And in addition to the existing payment options, new ones are constantly emerging as technology never stands still.
We have compiled some interesting statistics on cross-border payments to give you a better understanding of this market and perhaps provide you with some valuable insights.
What is the size of the cross-border payments industry?
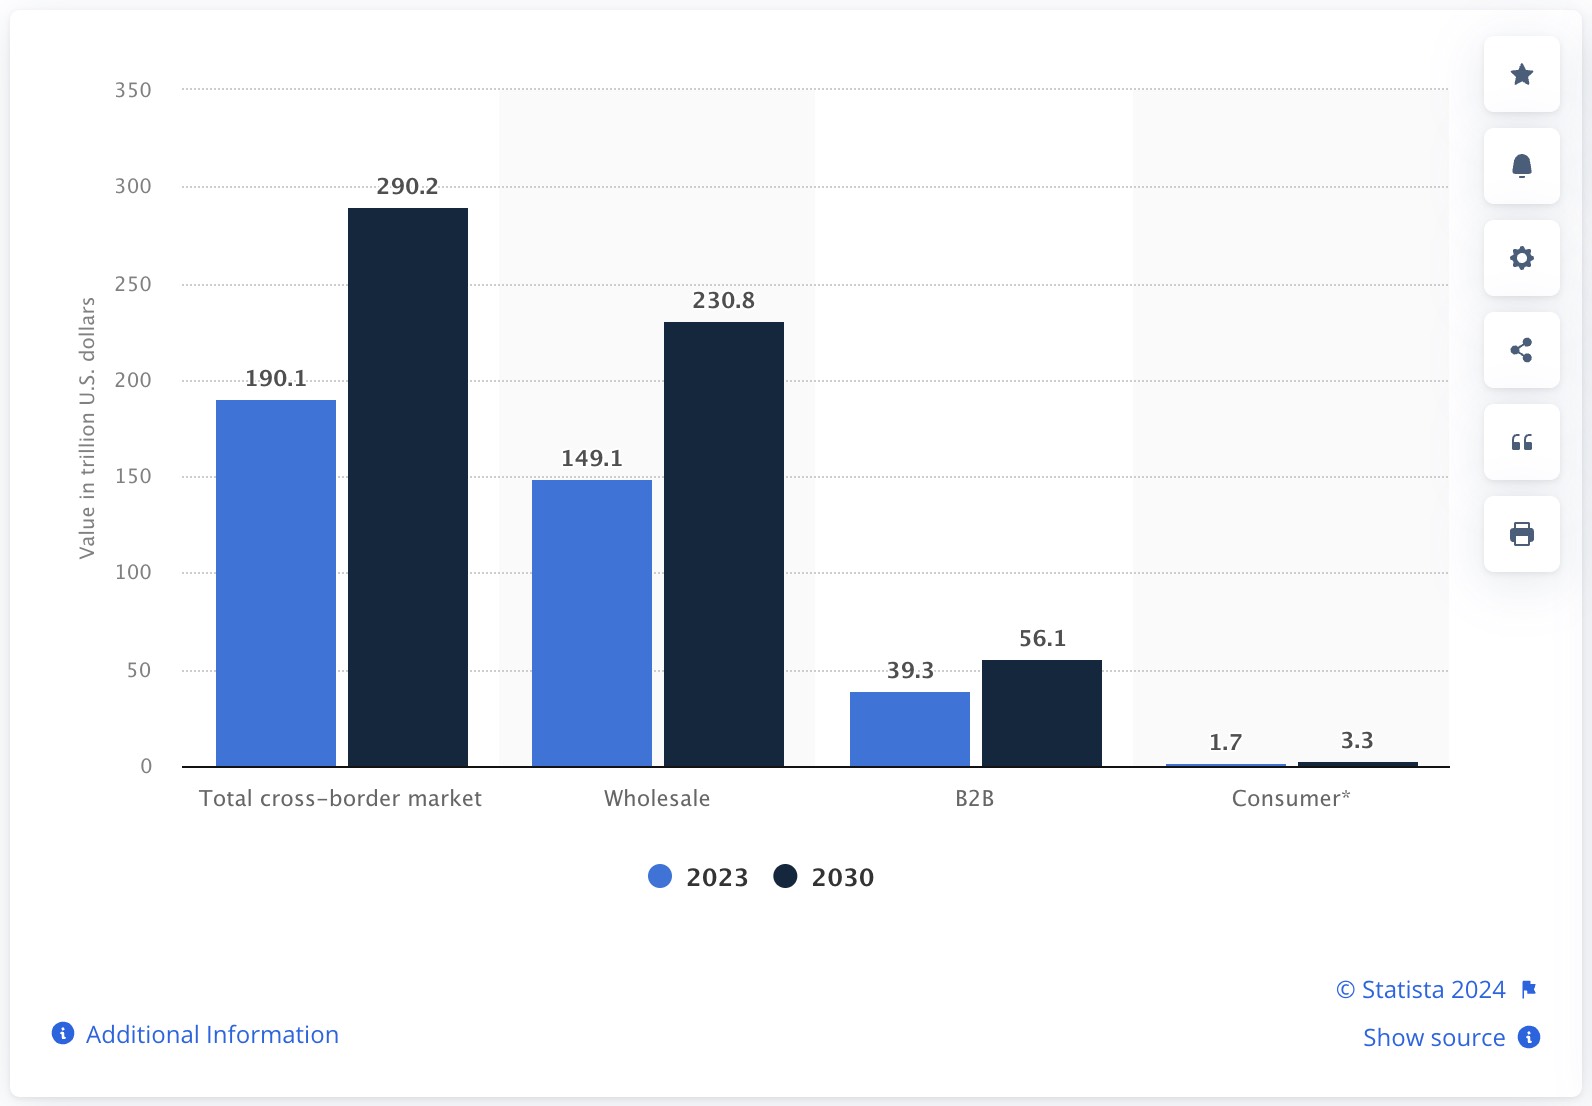
1. Global payments are expected to grow from $190tn in 2023 to a staggering $290tn by 2030, according to FXC Intelligence.
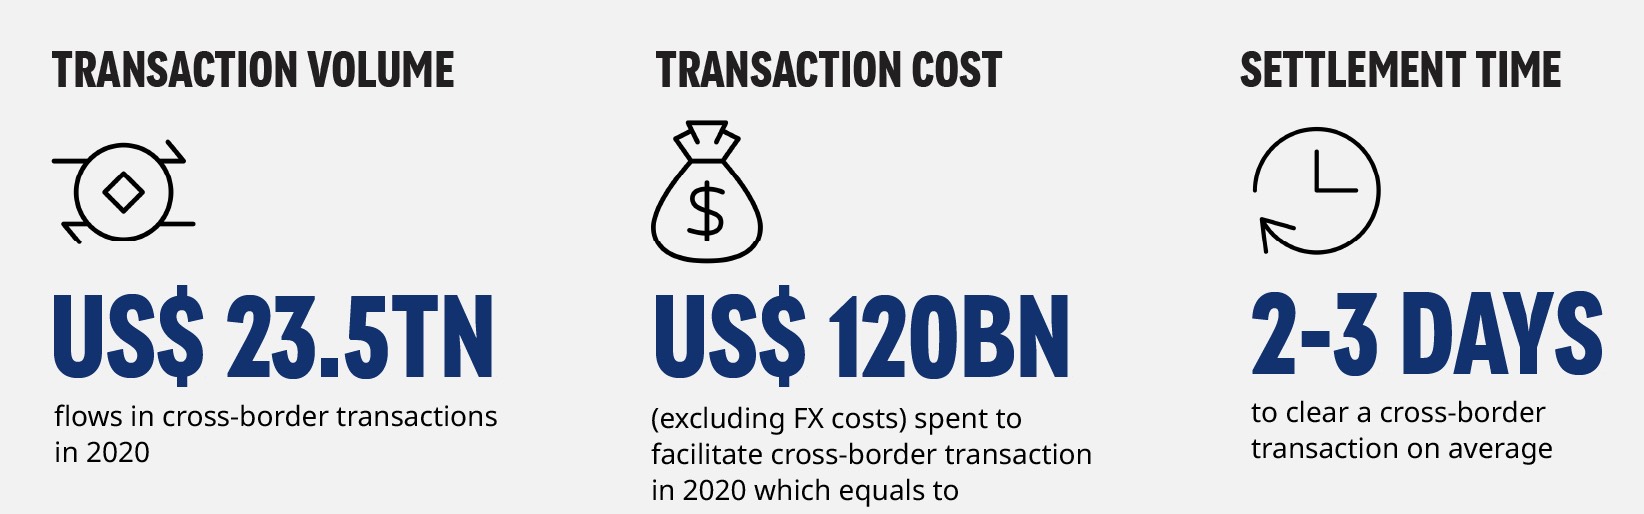
2. Global companies move nearly $23.5 trillion across borders each year, incurring transaction costs of more than $120 billion annually (excluding foreign exchange costs). – Oliver Wyman
3. There are more than 26,000 rules associated with global payments. Therefore, the best payment method depends on your location, your goals, and your expectations. – FEI.
International transfers are expected to grow by five percent per year through 2027. This will be driven in part by previously unbanked populations gaining access to modern financial tools for the first time. – J. P. Morgan.
5. Fees for international payments currently average 1.5 percent for businesses and up to 6.3 percent for remittances. – Bank of Italy.
6. There is a list of the 5 most used currencies in the world for international payments in SWIFT: US Dollar (USD), Euro (EU), Japanese Yen (JPY), Pound Sterling (GBP) and Chinese Yuan (CNY).
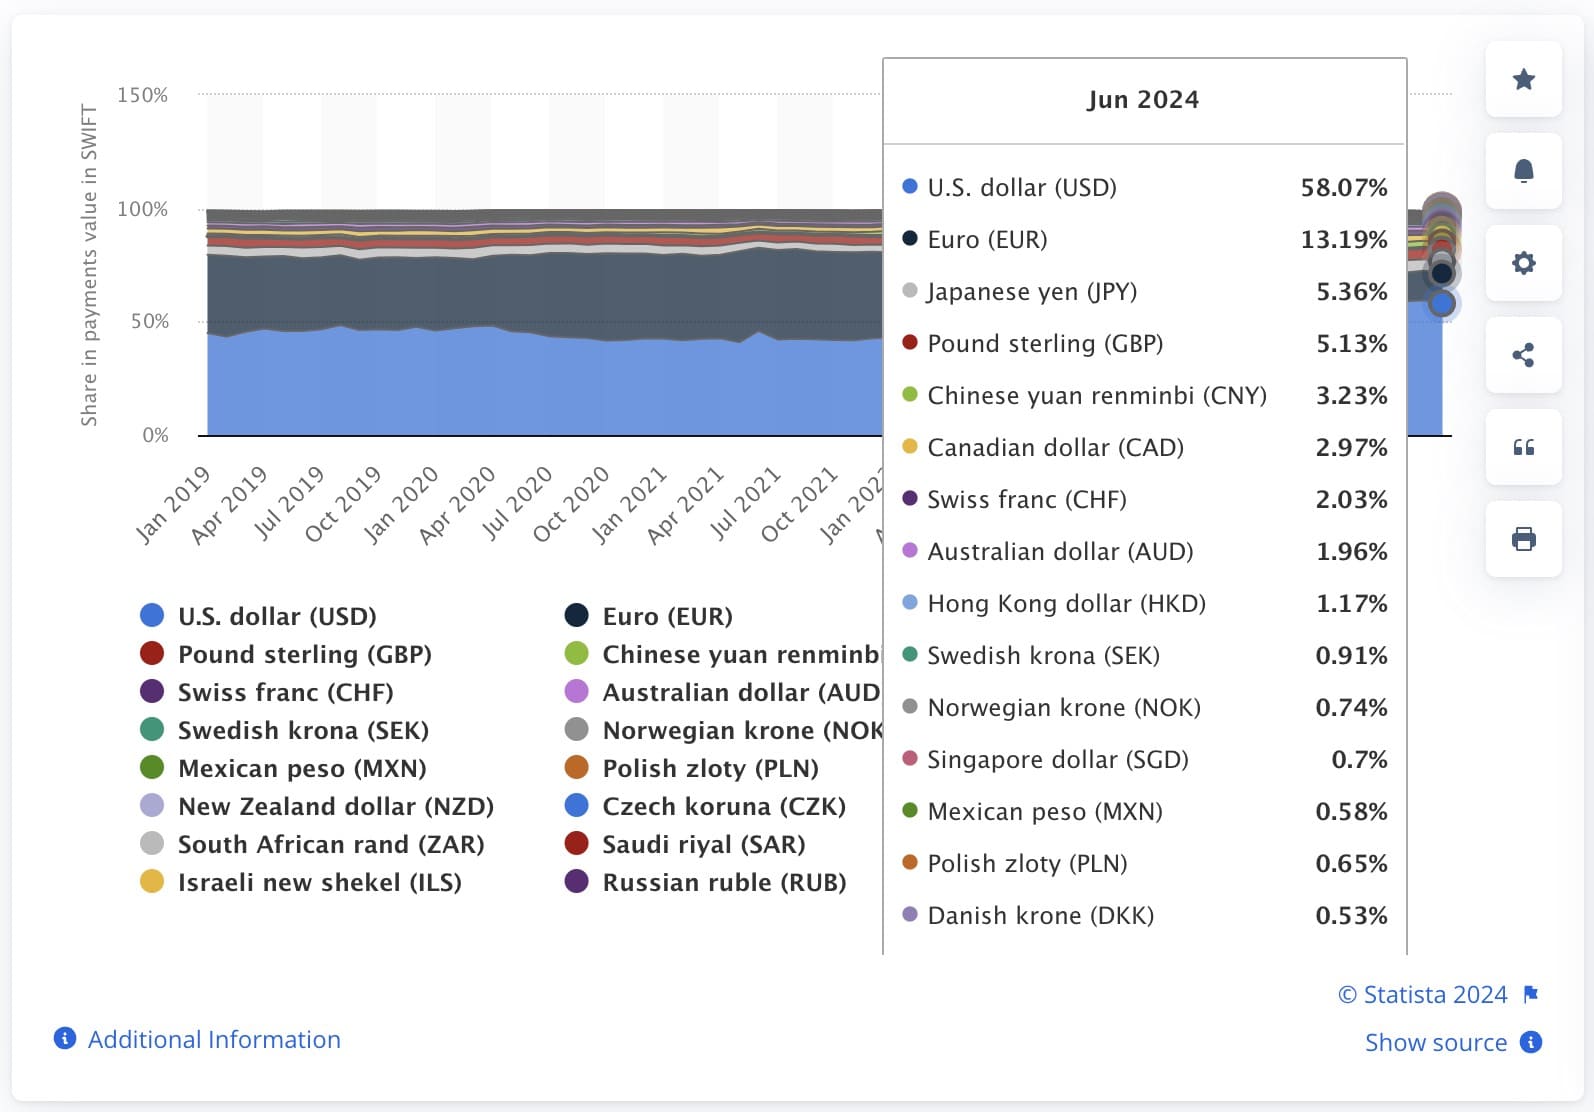
7. The euro and US dollar account for more than seven out of 10 SWIFT payments worldwide in 2024, outpacing many other currencies.
With a CAGR of over 20%, Asia Pacific is the fastest growing region for cross-border payments.
9. The United States dominates the North American cross-border payments market with a 37% share.
10. The UK is the leading country for cross-border payments in Europe, with a market share of 23%.
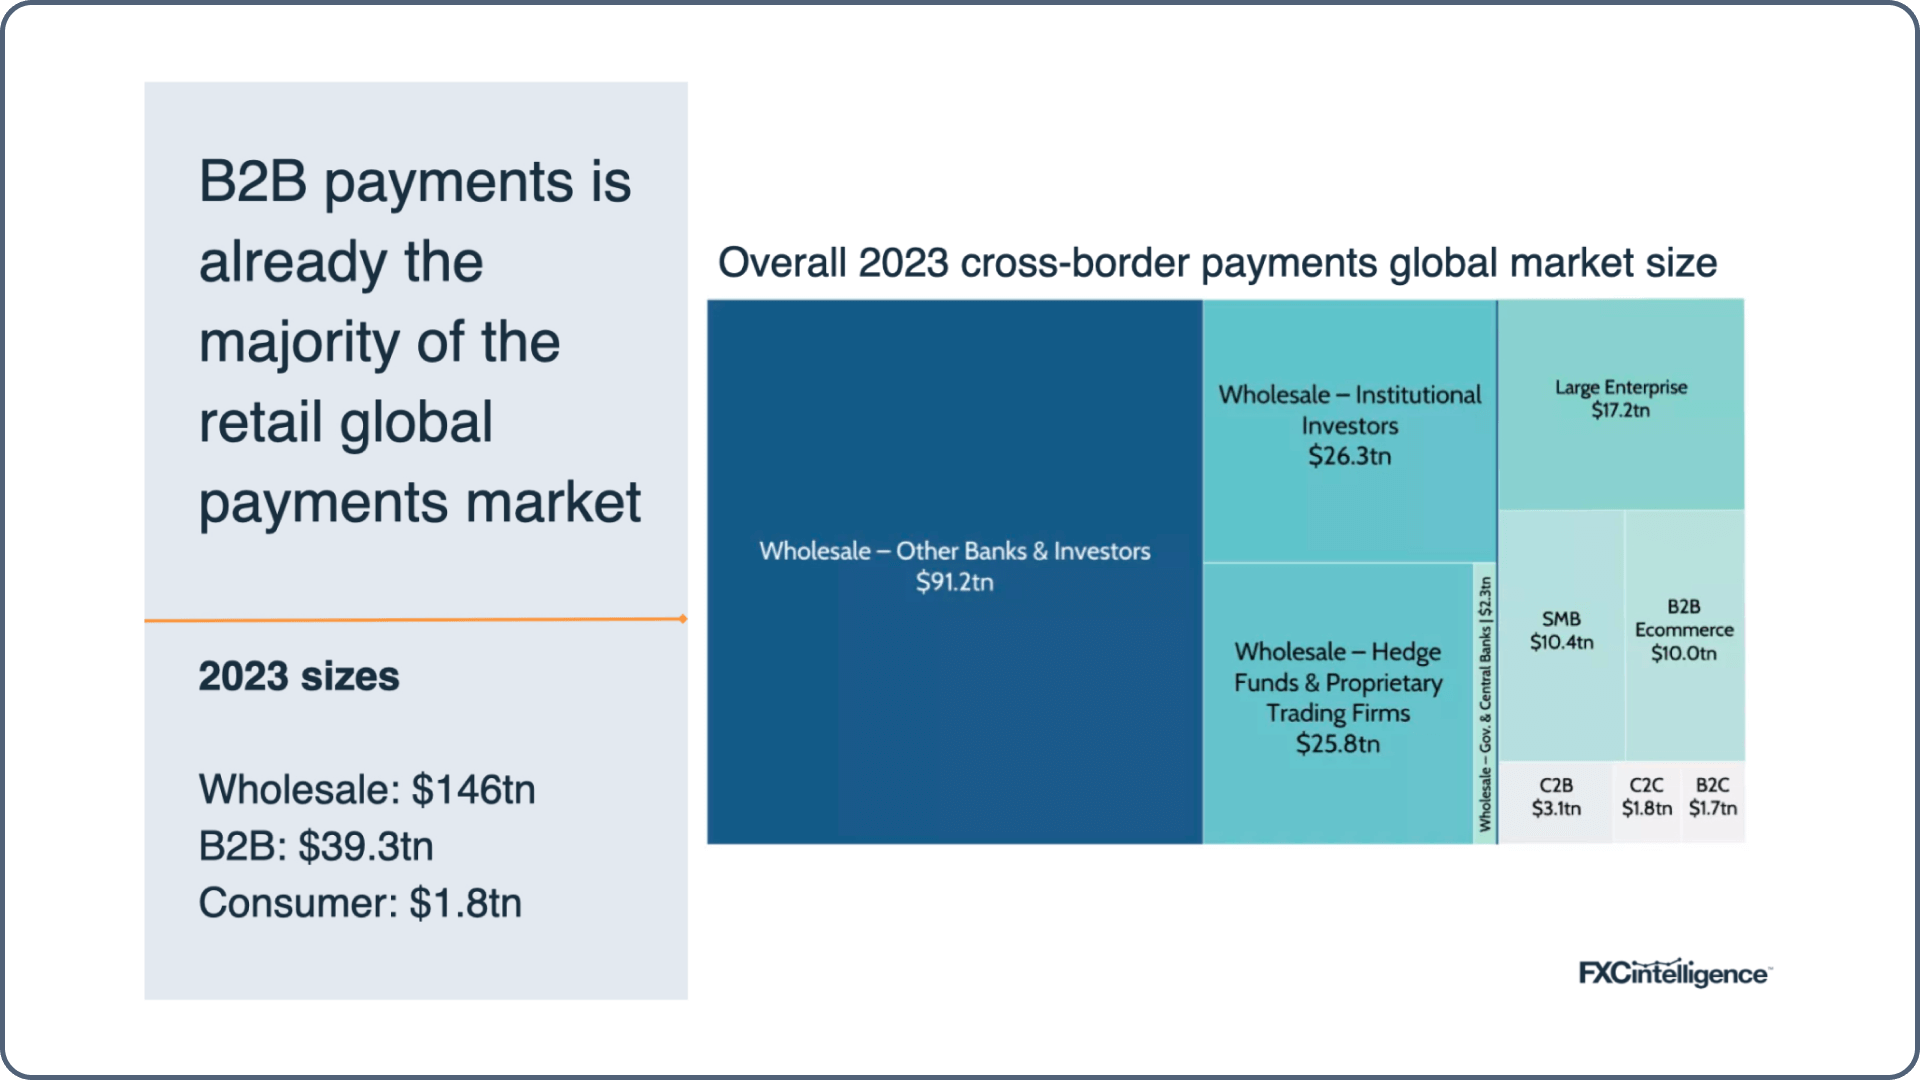
11. The biggest driver of B2B cross-border payments growth will be B2B e-commerce, which will overtake large enterprises to become the largest segment by 2030.
12. Accepting cross-border payments can expand your business’s reach, but it also exposes you to cybersecurity risks. Global CNP fraud has tripled, rising from $9.84 billion in 2011 to $32.39 billion in 2020, with an average wire fraud loss of $8,304 per incident. – Vesta.io
13. Transfer fees for each cross-border transaction range from 0.25% to 3% of the transaction amount, depending on the destination.
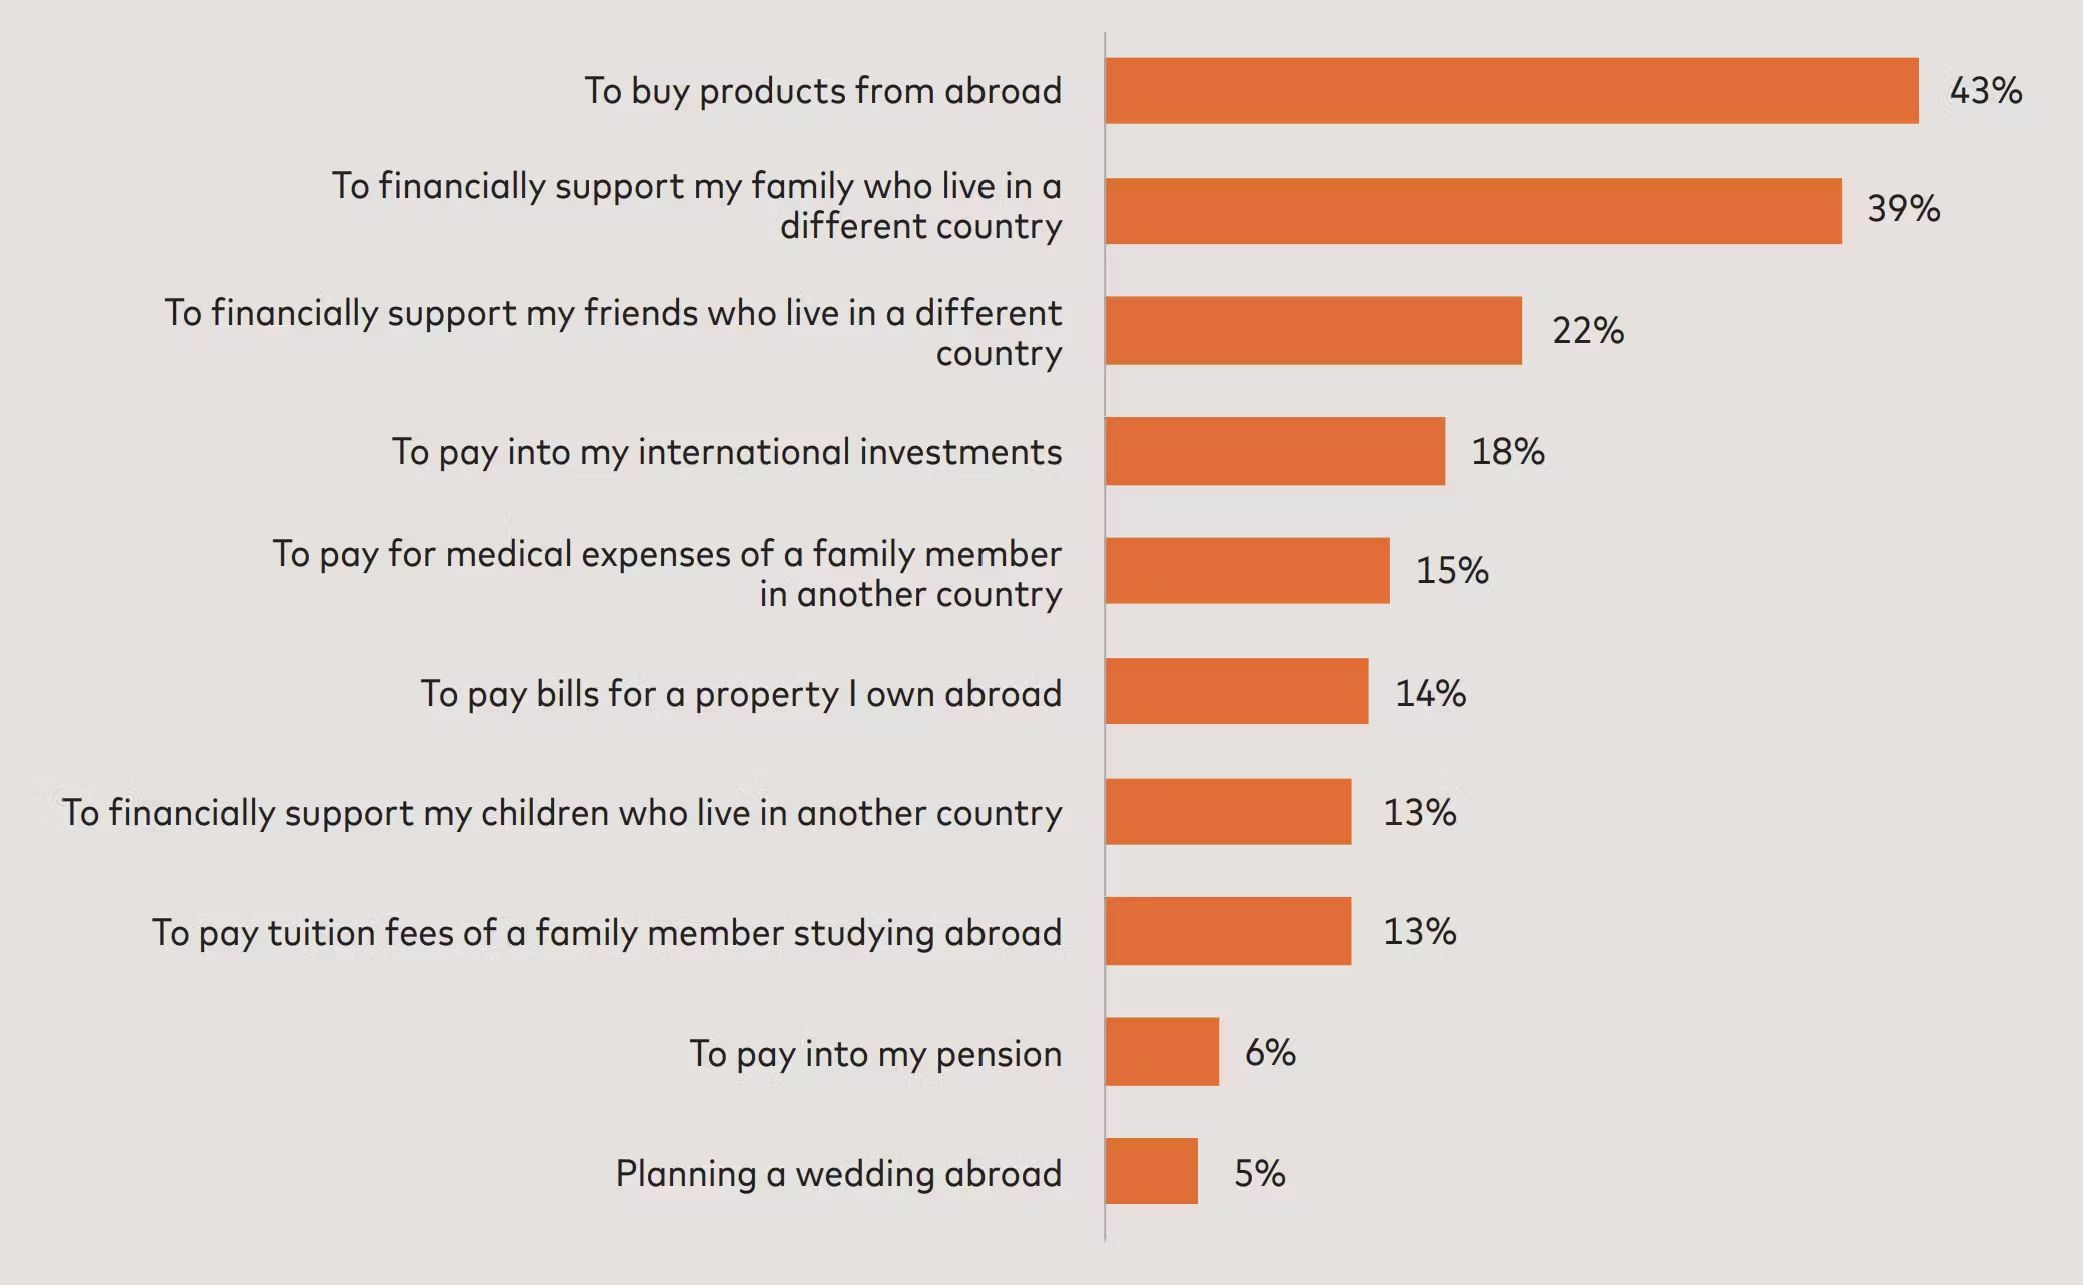
14. The Mastercard Borderless Payments Report provides valuable insights into how consumers are using cross-border payments.
68% of small businesses agree the functioning of the global payment network enabled them to survive. – Mastercard.
16. Business-to-business (B2B) payments account for the vast majority of cross-border payments. – Ernst & Young Global Limited.
17. Globally, 58% of all cross-border transactions are card payments. – WorldMetrics
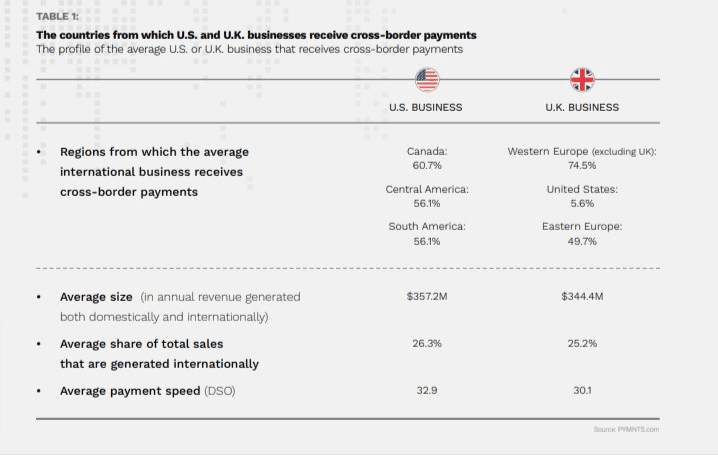
18. For US and UK businesses, cross-border payments take 55% longer than domestic payments. – PYMNTS.
19. UK companies traded primarily with Western Europe (74.5%), Eastern Europe (49.7%) and the United States (5.6%).
International transfers with your Omega account are easy, fast and reliable. Ready to get started? Open an account.